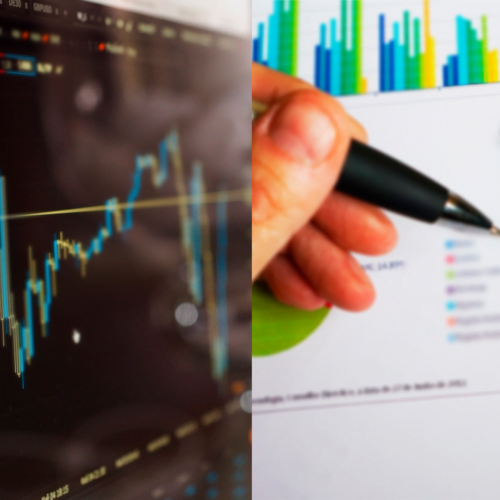
Technical Analysis vs Fundamental Analysis is a discussion that has been around for a long time regarding trading. Both analyses are popular methods used by investors and traders to evaluate securities and assets. Also, both approaches have their own strengths and weaknesses, but which one is best?
Let’s start from the beginning!
What is Technical Analysis?
Technical analysis is a method of predicting the future price movements of a security based on its past performance. Technical analysts believe that the market is efficient, meaning that all available information is already reflected in the price of a security. Therefore, technical analysts focus on analyzing charts and other technical indicators to identify trends and patterns that can be used to make predictions about future price movements.
Advantages and disadvantages
One of the key advantages of technical analysis is that it is objective and data-driven. In this type of analysis, technical analysts use a variety of tools and techniques, such as trend lines, moving averages, and oscillators, to analyze historical price data and identify patterns and trends. This can provide a clear and unbiased view of the market and help traders make more informed decisions.
However, technical analysis also has its limitations. One of the biggest criticisms of technical analysis is that it is based on the assumption that past performance is indicative of future performance. This assumption may not always be true, and relying too heavily on technical analysis can lead to inaccurate predictions and potentially costly mistakes.
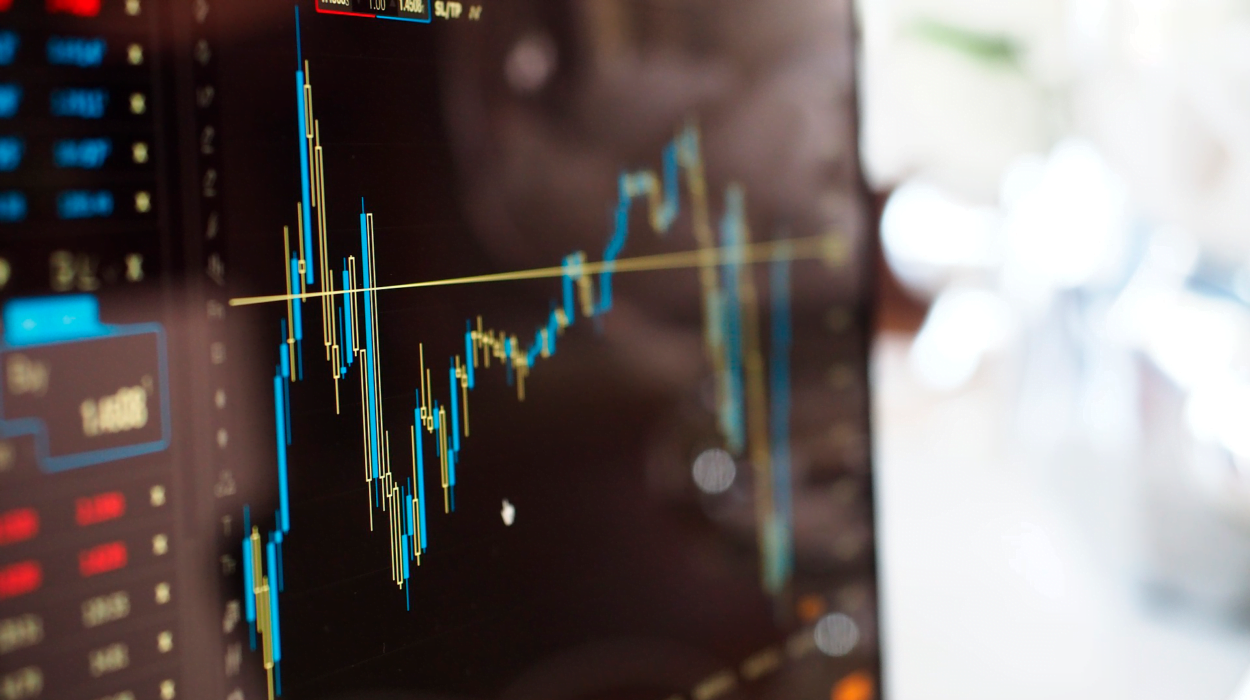
Technical Analysis chart
What is Fundamental Analysis?
Fundamental analysis, on the other hand, is a method of evaluating a security based on its underlying value. Fundamental analysts believe that the true value of a security is determined by the underlying factors that drive the performance of the company or asset, such as its earnings, revenue, and management. By analyzing these and other fundamental factors, fundamental analysts aim to determine the intrinsic value of a security and compare it to its market price.
Advantages and disadvantages of Fundamental analysis
One of the key advantages of fundamental analysis is that it takes into account a wide range of factors that can impact the value of a security. This can help investors make more informed decisions and avoid overpaying for a security. Additionally, fundamental analysis can provide valuable insights into a company’s long-term prospects and potential risks, which can be useful for investors with a long-term horizon.
However, fundamental analysis also has its limitations. One of the biggest criticisms of fundamental analysis is that it is subjective and can be subject to interpretation. Different analysts may have different opinions on the intrinsic value of a security, which can lead to disagreement and confusion. Furthermore, fundamental analysis can be time-consuming and require a significant amount of research, which may not be practical for traders who need to make quick decisions.
Fundamental Analysis
Conclusion: So which one is best?
Both technical analysis and fundamental analysis are valuable tools for investors and traders. Technical analysis provides a data-driven, objective approach to analyzing securities, while fundamental analysis offers insights into the underlying factors that drive the performance of a security. That’s why many investors use a combination of both approaches in their decision-making process, as each can provide valuable insights and help to reduce risk.
Technical Analysis vs Fundamental Analysis: Which one do you think is best? Let us know!
Got a comment on this article? Join the conversation on Facebook, Twitter or LinkedIn and share your thoughts.
You may have never heard of the Fibonacci sequence, but it’s a mathematical formula that has been around for hundreds of years and is used to analyse financial markets. This article will explore the Fibonacci sequence and why it’s so important.
What is the Fibonacci Sequence?
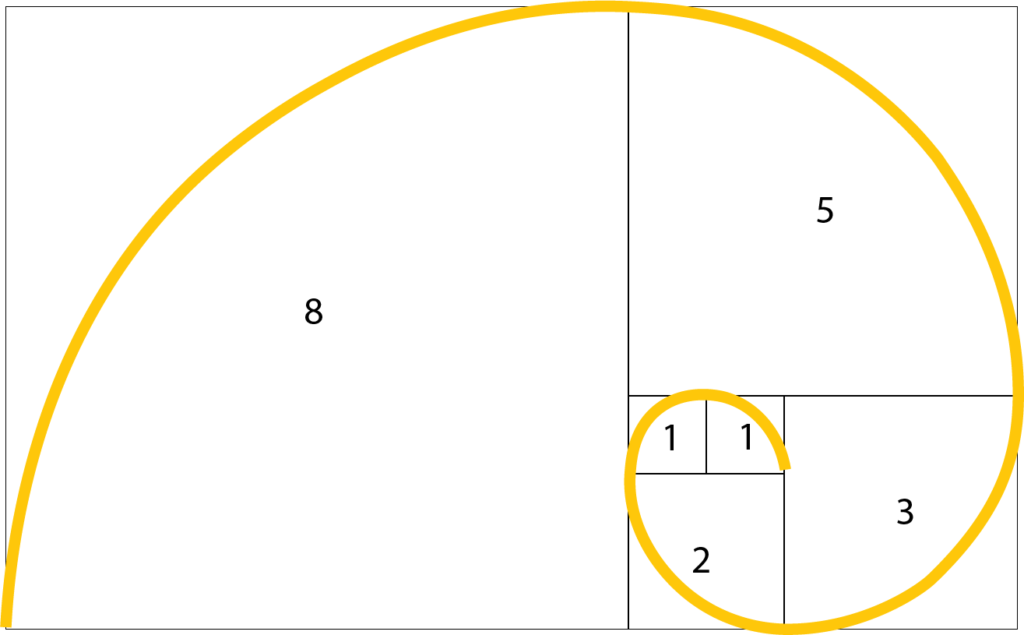
The Fibonacci Sequence is a series of numbers that starts with 0 and 1, and each subsequent number is the sum of the previous two. So, the sequence goes 0, 1, 1, 2, 3, 5, 8, 13, 21, 34, 55, 89… and so on indefinitely.
Where did it come from?
In 1202, an Italian mathematician named Leonardo Fibonacci published a book called Liber Abaci (Book of Calculation). In it, he introduced the Hindu-Arabic numeral system to the Western World. He also popularised a simple numerical sequence in which each number is the sum of the previous two (the Fibonacci sequence).
Why is it so important?
Well, the Fibonacci Sequence appears in nature quite often!
It can be found in the arrangement of leaves on a stem, the pattern of petals on a flower (typically come in sets of 3s or 5s), or even in spiral galaxies. Also, many animals have body parts that follow the sequence – for example, a rabbit has five toes on its front paws and three on its back paws.
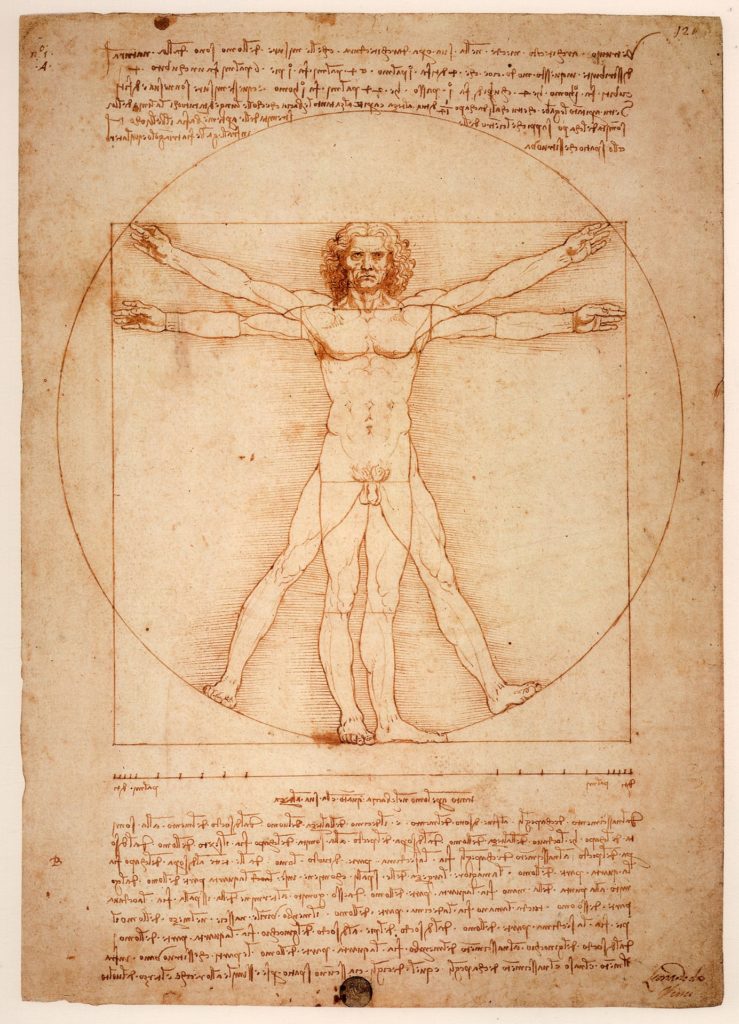
It also has applications in mathematics, art, architecture and financial markets. For example, the golden ratio – is characterised by the fact that the quotient between any term in the series and the preceding term always tends to the same value (1.618) as you progress through the series. This proportion occurs often in nature and has been used by artists such as Leonardo da Vinci to create aesthetically pleasing compositions, like Mona Lisa and Vitruvian Man.
Golden ratio calculation/demonstration:
1/1 = 1
2/1=2
3/2=1,5
5/3=1.6666..
8/5=1,6
21/13=1,615348
13/8=1,625
34/21=1,61904
55/34=1,61764
89/55=1,161818
144/89=1,611798
Vitruvian Man by Leonardo da Vinci
What are the Benefits of Learning About the Fibonacci Sequence?
If you enjoy maths, then learning about the Fibonacci sequence can be a fun and interesting way to explore a fascinating mathematical concept. Even if you don’t particularly enjoy maths, understanding the Fibonacci sequence can still offer some benefits. Here are a few reasons why learning about the Fibonacci sequence can be beneficial:
1. Help improve your problem-solving skills.
The Fibonacci sequence is all about patterns and relationships between numbers. Understanding it can help you become better at spotting patterns and solving problems in general.
2. Make you appreciate maths more.
Let’s face it: for many people, maths is not an enjoyable subject. However, the Fibonacci sequence is a perfect example of how maths can be beautiful and fascinating. Learning about it may just make you appreciate maths a little bit more.
3. Help you understand nature better.
The Fibonacci sequence is found throughout nature, from the arrangement of leaves on a plant to the spiral of a seashell. Understanding this connection between mathematics and nature can help you appreciate both subjects more.
Fibonacci sequence number in spiral
Fibonacci sequence in financial markets
In economics, several concepts are based on Fibonacci numbers, including Fibonacci retracements/expansion and Elliott Wave Principle.
These concepts help technical analysts to define more precisely the key points of trend changes and movement corrections, for example: if the market is moving up and then suddenly reverses direction, it might be because it has reached a Fibonacci expansion or retracement level. This level could be a support or resistance level that traders watch for clues about where the market is headed next.
Fibonacci levels are especially important to day traders who look for short-term opportunities in the market. By understanding how Fibonacci levels work, day traders can better predict when to enter and exit trades.
Curiosities
1. The use of the golden ratio is the secret of the world’s most resistant structures such as the Great Pyramid of Quéops ( Khufu ) built around 2560 B.C;
2. The seeds of a sunflower are usually arranged in two groups of spirals in the core of the flower: 21 clockwise and 34 counterclockwise;
3. If a person of average stature divides his height by the distance between his navel and his head, the result will be around 1.618;
4. As already mentioned, the Fibonacci sequence is found in Leonardo da Vinci’s “Mona Lisa” in the relationship between the torso and the head of the depicted figure as well as in the elements of the face;
5. Each block of the Egyptian pyramids is 1,618 times smaller than the one below it.
Conclusion
The Fibonacci sequence is a mathematical concept that has many applications in the real world. It can be used to predict population growth, calculate financial risks, and even understand animal proportions. While it may seem like a dry topic, understanding Fibonacci can provide insights into some of the most fascinating patterns in nature. So on this Fibonacci Day, take some time to learn about this incredible sequence and its far-reaching implications.
Got a comment on this article? Join the conversation on Facebook, Instagram, Twitter or LinkedIn and share your thoughts.
Technical analysis is the study of past market data in order to help predict future prices. It does this by examining trading volumes and trends, price changes and other events associated with the market. In this blog post, you’ll learn more about technical analysis – including its definition, some of the concepts and who uses it.
What is Technical Analysis?
Technical analysis is the process of using past price data to identify market trends and make future price predictions. The experts in the field believe that prices move in cycles and that these cycles can be identified and used to make trading decisions.
Many different techniques can be used, but some of the most popular include trend line analysis, support and resistance levels, and candlestick charting. Technical analysts will often use a combination of these techniques to make the most accurate predictions possible.
While technical analysis can be used in any time frame, it is most commonly used by day traders or short-term traders who are looking to take advantage of small price movements.
Candlestick chart
Benefits
Technical analysis is a security analysis discipline for forecasting the direction of prices through the study of past market data, primarily price and volume.
The benefits of technical analysis are numerous, but some of the most notable include:
1. The ability to identify trends: One of the primary goals of technical analysis is to identify whether a security is in an uptrend, downtrend, or sideways trend. This information can be used to make informed decisions about when to buy or sell a security.
2. The ability to forecast future prices: Technical analysts use historical price data and other market indicators to try and predict where prices are headed in the future. While no one can predict the future with 100% accuracy, technical analysis can give investors an edge in making investment decisions.
3. The ability to make better-informed decisions: By taking into account factors such as trends, support and resistance levels, and price patterns, technical analysis can help investors make more informed decisions about when to buy or sell a security. This can lead to improved investment returns over time.
Disadvantages
There are a few disadvantages to be aware of. First, past performance is no guarantee of future results – what worked in the past may not work in the future. Second, technical analysis is based on price and volume data, which can be subject to interpretation. And third, even with the best tools and indicators, success in trading still comes down to human factors like psychology and emotion.
Who uses technical analysis?
Technical analysis is used by a wide variety of market participants for different purposes. Some use it to attempt to identify patterns that may indicate a future market direction, while others use it to generate trading signals or develop trading systems. There are also those who use technical analysis as part of a more comprehensive investment strategy that includes other factors such as fundamental analysis and risk management.
The common thread among all users of technical analysis is the belief that past price data can provide insights into future market behaviour. As a result, technical analysts believe that it is possible to identify patterns in past price data that can be used to predict future market movements.
One of the most important things to remember about technical analysis is that there is no one right way to do it. Different analysts may use different methods and indicators, and there is no guarantee that any particular approach will be successful. Technical analysis is an art as much as it is a science, and each analyst brings his or her unique perspective to the table.
Technical Analysis
Conclusion
Technical analysis is a powerful tool that can help traders and investors identify opportunities in the market. However, it is important to remember that technical analysis is not an exact science, and there is no guarantee that every signal will result in a profitable trade. Nevertheless, by understanding and correctly applying the concepts of technical analysis, traders and investors can give themselves a better chance of success in the financial markets.
We use cookies on our website to give you the most relevant experience by remembering your preferences and repeat visits. By clicking “Accept All”, you consent to the use of ALL the cookies. However, you may visit "Cookie Settings" to provide a controlled consent.
This website uses cookies to improve your experience while you navigate through the website. Out of these, the cookies that are categorized as necessary are stored on your browser as they are essential for the working of basic functionalities of the website. We also use third-party cookies that help us analyze and understand how you use this website. These cookies will be stored in your browser only with your consent. You also have the option to opt-out of these cookies. But opting out of some of these cookies may affect your browsing experience.
Necessary cookies are absolutely essential for the website to function properly. These cookies ensure basic functionalities and security features of the website, anonymously.
Cookie
Duration
Description
cookielawinfo-checkbox-advertisement
1 year
Set by the GDPR Cookie Consent plugin, this cookie is used to record the user consent for the cookies in the "Advertisement" category .
cookielawinfo-checkbox-analytics
11 months
This cookie is set by GDPR Cookie Consent plugin. The cookie is used to store the user consent for the cookies in the category "Analytics".
cookielawinfo-checkbox-functional
11 months
The cookie is set by GDPR cookie consent to record the user consent for the cookies in the category "Functional".
cookielawinfo-checkbox-necessary
11 months
This cookie is set by GDPR Cookie Consent plugin. The cookies is used to store the user consent for the cookies in the category "Necessary".
cookielawinfo-checkbox-others
11 months
This cookie is set by GDPR Cookie Consent plugin. The cookie is used to store the user consent for the cookies in the category "Other.
cookielawinfo-checkbox-performance
11 months
This cookie is set by GDPR Cookie Consent plugin. The cookie is used to store the user consent for the cookies in the category "Performance".
elementor
never
This cookie is used by the website's WordPress theme. It allows the website owner to implement or change the website's content in real-time.
JSESSIONID
session
The JSESSIONID cookie is used by New Relic to store a session identifier so that New Relic can monitor session counts for an application.
viewed_cookie_policy
11 months
The cookie is set by the GDPR Cookie Consent plugin and is used to store whether or not user has consented to the use of cookies. It does not store any personal data.
Functional cookies help to perform certain functionalities like sharing the content of the website on social media platforms, collect feedbacks, and other third-party features.
Cookie
Duration
Description
__cf_bm
30 minutes
This cookie, set by Cloudflare, is used to support Cloudflare Bot Management.
messagesUtk
1 year 24 days
HubSpot sets this cookie to recognize visitors who chat via the chatflows tool.
This cookie is used to recognize visitors who chat with us via the messages tool. If we chat with a visitor who later returns to the website in the same cookied browser, the messages tool will load their conversation history.
Performance cookies are used to understand and analyze the key performance indexes of the website which helps in delivering a better user experience for the visitors.
Analytical cookies are used to understand how visitors interact with the website. These cookies help provide information on metrics the number of visitors, bounce rate, traffic source, etc.
Cookie
Duration
Description
__hssc
30 minutes
This cookie keeps track of sessions. This is used to determine if HubSpot should increment the session number and timestamps in the __hstc cookie
__hstc
13 months
The main cookie for tracking visitors. It contains the domain, utk, initial timestamp (first visit), last timestamp (last visit), current timestamp (this visit), and session number (increments for each subsequent session).
_ga
2 years
This cookie is installed by Google Analytics. The cookie is used to calculate visitor, session, campaign data and keep track of site usage for the site’s analytics report. The cookies store information anonymously and assigns a randomly generated number to identify unique visitors.
_gat
1 minute
This cookie is installed by Google Universal Analytics to restrain request rate and thus limit the collection of data on high traffic sites. These are third party cookies that are placed on your device to allow us to use the Google Analytics service. These cookies are used to collect information about how visitors use our website. We use this information to compile reports.
_gat ok __hs_opt_out
13 months
This cookie is used by the opt-in privacy policy to remember not to ask the visitor to accept cookies again.
_gid
1 day
This cookie is installed by Google Analytics. The cookie is used to store information of how visitors use a website and helps in creating an analytics report of how the website is doing. The data collected including the number visitors, the source where they have come from, and the pages visited in an anonymous form.
hubspotutk
13 months
This cookie keeps track of a visitor's identity. It is passed to HubSpot on form submission and used when deduplicating contacts.
mautic_device_id
12 months
Used by Mautic to track the Contact for either the tracking pixel or if the same key is not found in the brower's local storage for the monitored site.
tk_lr
11 months
This cookie is set by JetPack plugin on sites using WooCommerce. This is a referral cookie used for analyzing referrer behavior for Jetpack
tk_or
4 years
This cookie is set by JetPack plugin on sites using WooCommerce. This is a referral cookie used for analyzing referrer behavior for Jetpack
tk_r3d
3 days
The cookie is installed by JetPack. Used for the internal metrics for user activities to improve user experience
Advertisement cookies are used to provide visitors with relevant ads and marketing campaigns. These cookies track visitors across websites and collect information to provide customized ads.


Technical Analysis vs Fundamental Analysis – What’s the difference?
Fundamental Analysis, Learning to invest, Technical Analysis Beatriz Costa 0